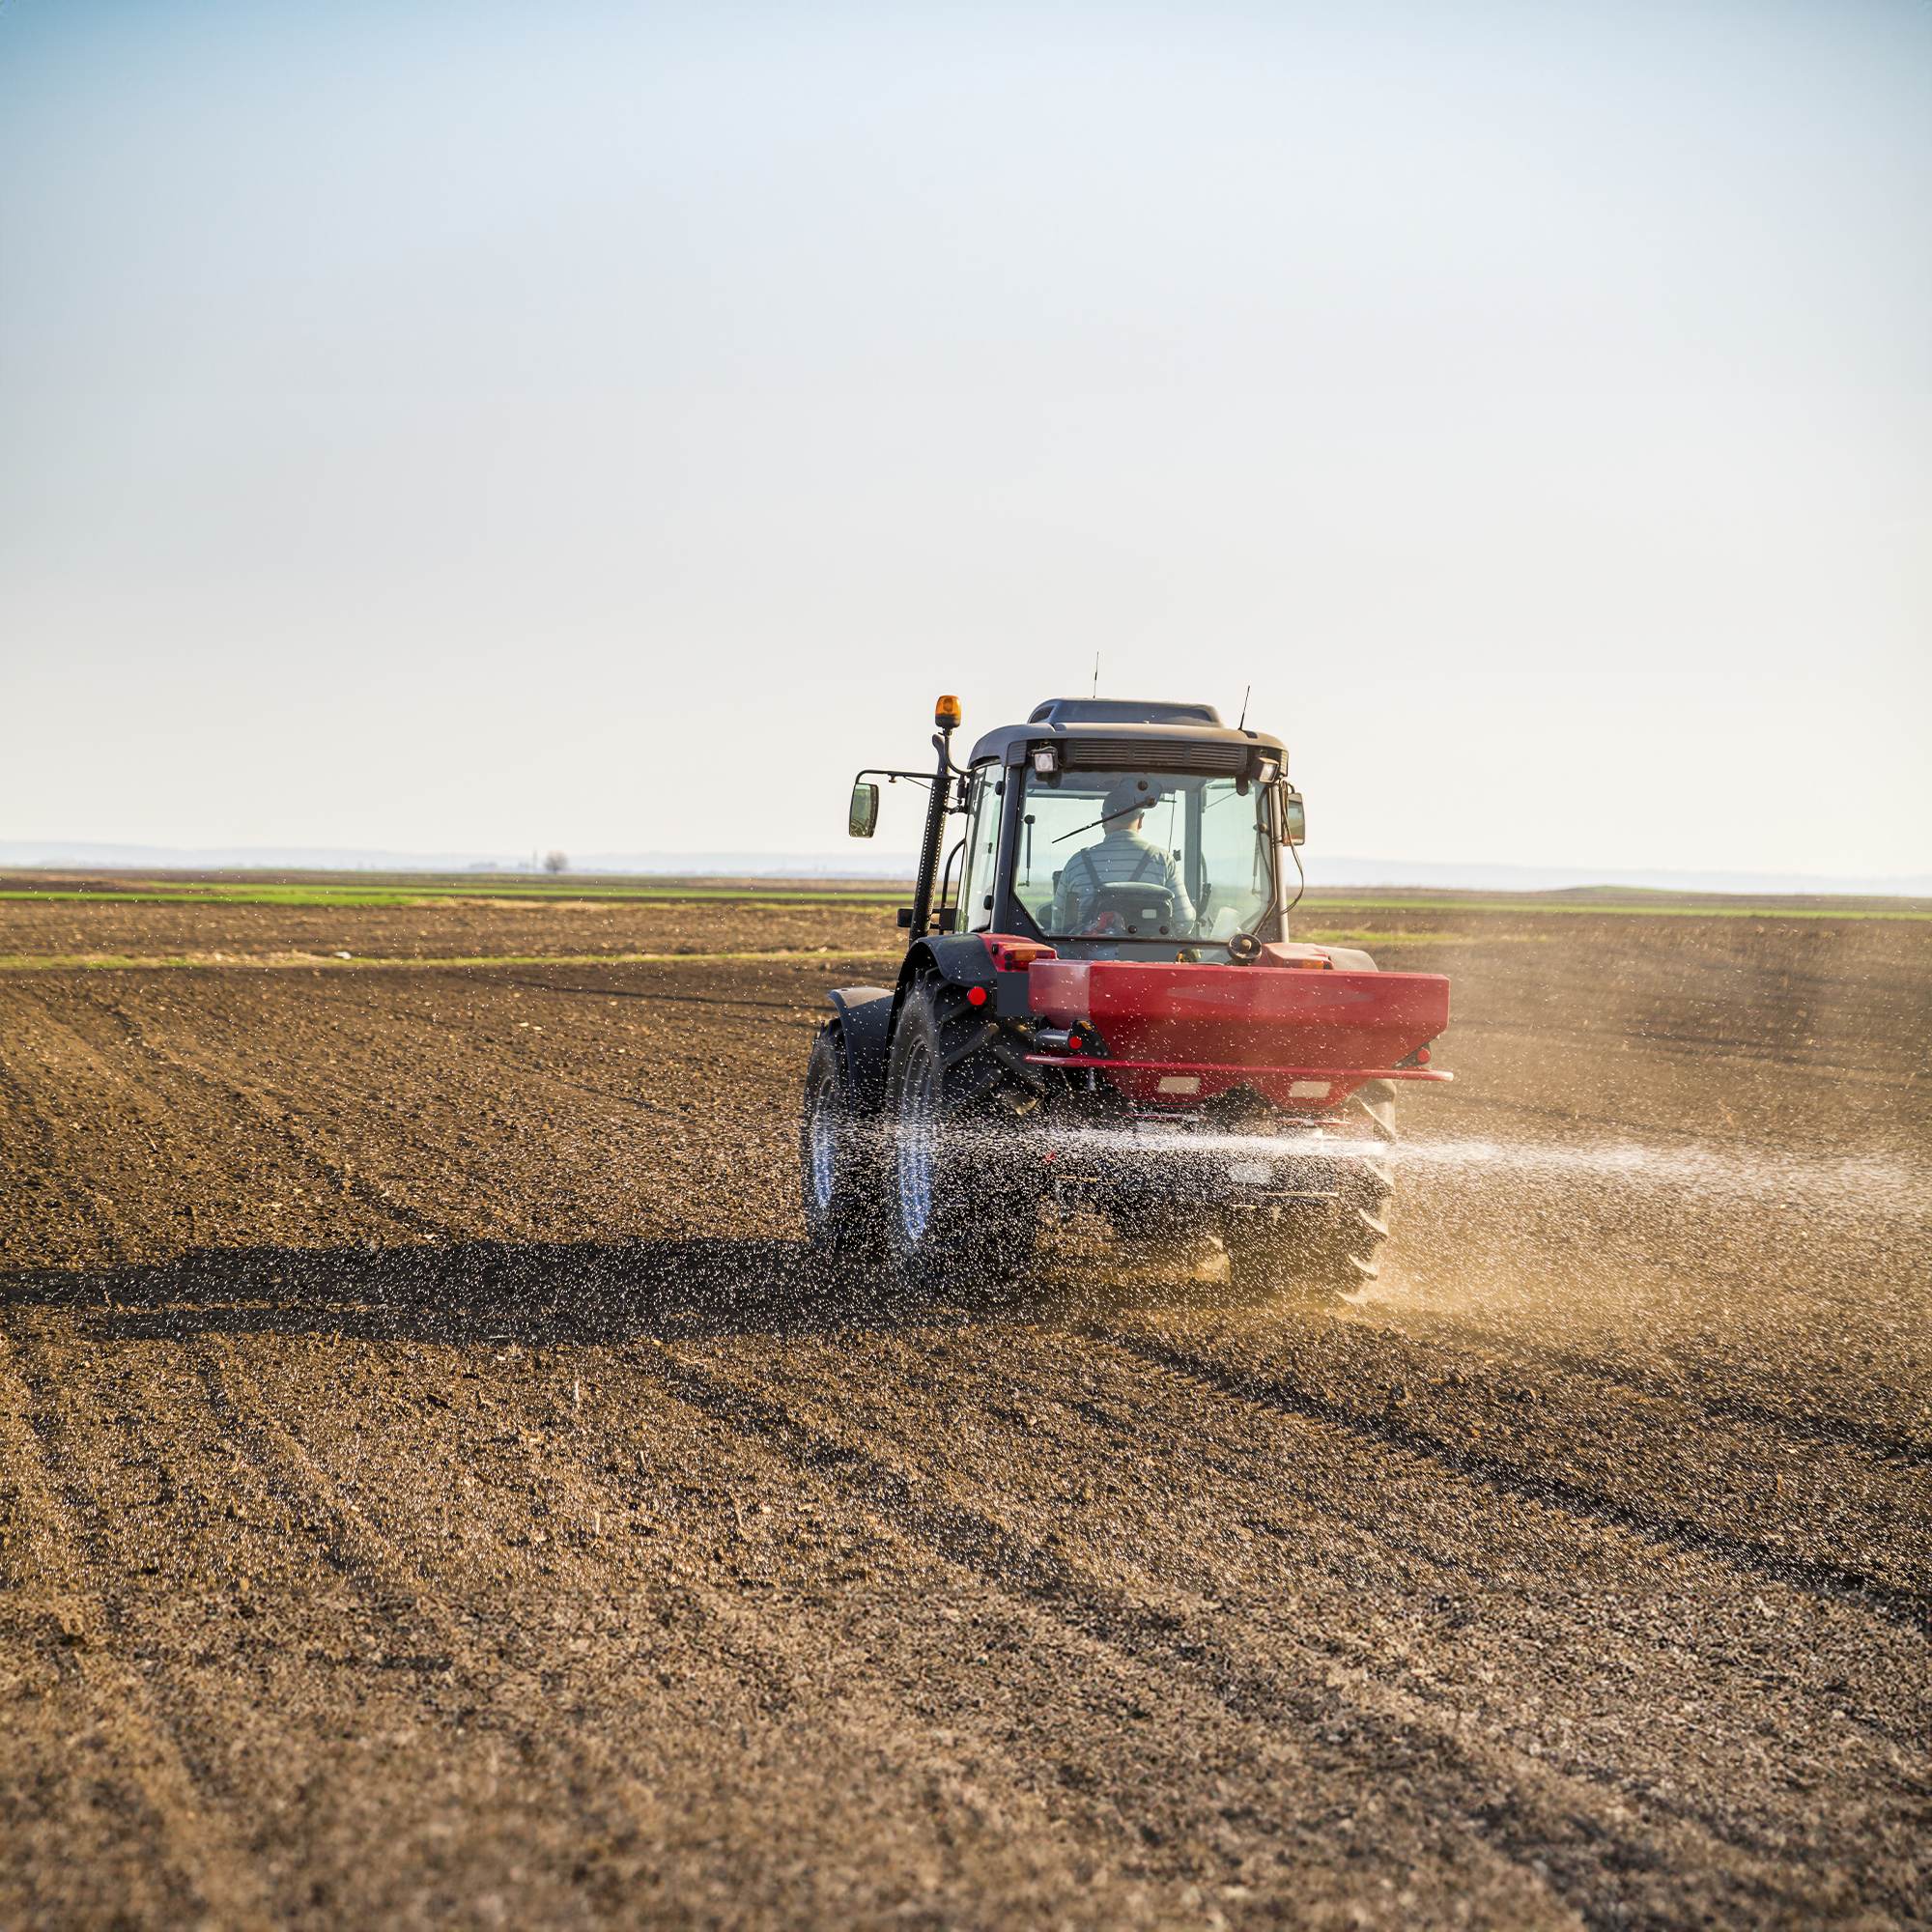
Fertilizers play a crucial role in today’s agriculture, as they improve soil fertility and stimulate crop yields. They provide essential nutrients such as nitrogen, phosphorus, and potassium, boosting effective plant growth. Additionally, fertilizers ensure global food security amid the changing climate and growing demographic in modern agriculture.
In this article, we will look at the current data, market dynamics, forecasts, and innovations shaping the fertilizer industry. Monitoring the global fertilizer market helps farmers make more reasonable decisions, minimize risks, and improve financial results.
Analysis of the Global Fertilizer Market by Countries and Regions
The report of the Mordor Intelligence service says that the volume of the fertilizer market is estimated at $381.7 billion in 2024. It is projected to reach $541.2 billion by 2030, with an average annual growth rate of 5.99% in 2024-2030.
This table contains basic information about key countries that produce fertilizers.
According to the report of the Mordor Intelligence service, the Asia-Pacific region holds the largest share in fertilizer production at 44.8%, followed by Europe and South America.
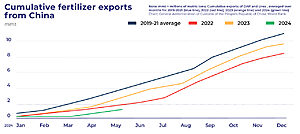
China is the largest producer and exporter of fertilizers in the region and the world, providing 25% of global fertilizer production. The Chinese fertilizer market in 2022 is estimated at $70.3 billion, and consumption is 94.2 million tons.
North America accounts for 17.8% of the global fertilizer market. The USA and Canada account for more than 90% of the fertilizers market volume. Although North America has phosphate and potassium resources, the region is a net importer of more than half of its nitrogen fertilizers and more than 85% of its potassium from international sources.
Europe’s share of the global market is 15.1%. France is one of the largest fertilizer-consuming countries in Europe.
South America accounts for 11.2%. Field crops dominate the South American fertilizer market with a 95% share.
World Bank Report
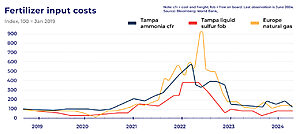
The World Bank’s fertilizer price index remained relatively stable in the second quarter of 2024 after a 20-percent drop in the first quarter. The index is 24% lower than a year ago, mainly due to a significant decrease in prices for phosphate rock (-56%) and potassium (-17%). This general weakness is attributed to improved production prospects, mainly due to lower input costs.
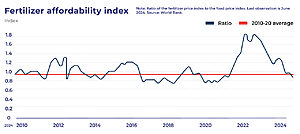
In the second quarter of 2024, the fertilizer availability index (the ratio of fertilizer prices to food prices) reached the average level of 2015-19.
Compared to 2023, prices are expected to be lower on average in 2024 and 2025 but remain well above 2015-19 levels due to sustained demand, some export restrictions (especially from China), and sanctions (mainly Belarus).
The risks of raising the forecast include a potential increase in input costs, especially for natural gas. However, the resumption of Chinese exports and lower-than-expected crop prices may contribute to a further decline in fertilizer prices.
Key Inputs for Fertilizer Production
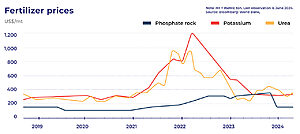
Although fertilizer costs have decreased significantly compared to the peak values of 2022-2023, they are still higher than in 2020.
The main resources for fertilizers production, the prices of which have significantly decreased compared to the record values of 2022-2023, have demonstrated some stability over the past two quarters. For example, natural gas prices in Europe increased by almost 15% in the second quarter of 2024, but are still 11% lower than a year ago. Natural gas is the most important component of nitrogen fertilizer costs.
Similarly, sulfur prices dropped about 26% lower compared to the previous year.
However, over the past four quarters, the average prices for these 3 resources have been more than 30% higher than the average values for 2015-2019.
World Trade Diversions
Despite export restrictions and sanctions, trade diversions have significantly mitigated their impact.
While exports of phosphate from China and ammonia from Russia affected global trade flows, Europe replaced imports from China and Russia with imports from other exporters, including Egypt (ammonia), Morocco (phosphate), Saudi Arabia, and the United States.
As for potash, despite the sanctions imposed against Belarus and Russia, which together account for almost half of the world’s potassium production, exports from both countries turned out to be stronger than expected due to the diversion of trade. Belarus has increased exports to China, and Russia has expanded railway capacity to facilitate supplies to Belarus. Meanwhile, exports from Canada have been redirected to Europe.
Fertilizer Affordability
The availability of fertilizers has returned to the average value in 2019. The decrease in fertilizer prices over the past few quarters has led the fertilizer availability index (the ratio of fertilizer prices to food prices) to the level of 2015-19.
During the spike in fertilizer prices in 2022, the affordability index almost doubled from its long-term average.
Fertilizer Supply Forecast
The IFA (International Fertilizer Association) report says that global ammonia production capacity will grow by 8% from 192 to 207 million tons between 2023 and 2028. Capacity increases are expected in all regions: by 4% in China and India, and by 14% in West Asia, Africa, and Europe. The United States will also significantly increase its ammonia production by 11% in the next five years due to tax incentives introduced under the IRA in 2022.
The world’s production of phosphoric acid will increase by 10% from 2023 to 2028. The capacity increase will mainly come from existing producers in Morocco and Saudi Arabia, while small additional capacities are also expected in India, Brazil, and Egypt.
In 2028, potash production capacity will increase by 19% to 76 million tons compared to 2023. By 2026, Laos and Russia will make the main contribution to this growth. A second wave of new capacity is expected in 2027. Investments in new mines will lead to the start of production in Canada, Russia, and Belarus.
Consumption Forecast
According to the IFA report, fertilizer consumption is expected to continue growing, but its rate will decrease from 2.2% in 2025 to 1.5% in 2028. This is consistent with expectations of improved nutrient efficiency and slower growth in food production.
The consumption of phosphorus and potassium will grow faster than the consumption of nitrogen. Between 2024 and 2028, potash consumption is projected to increase by 10%, compared with 8% for phosphorus and 6% for nitrogen.
Latin America and South Asia will be the main engines of global growth, adding 3 to 4 million tons of nutrients each between 2024 and 2028.
Сonsumption in the EECA region will grow by 1.7 million tons (+15%) due to the recovery of the agricultural sector in Ukraine.
Consumption in East Asia is expected to increase by only 2% over 4 years, but this means an additional 1.5 million tons of nutrients due to the large market size.
Growth will be insignificant in mature markets such as North America and Eastern Europe. Consumption will increase by 0.8 and 0.9 million tons respectively.
Africa is projected to grow the fastest, increasing by 25% (2 million tons) in the next five years.
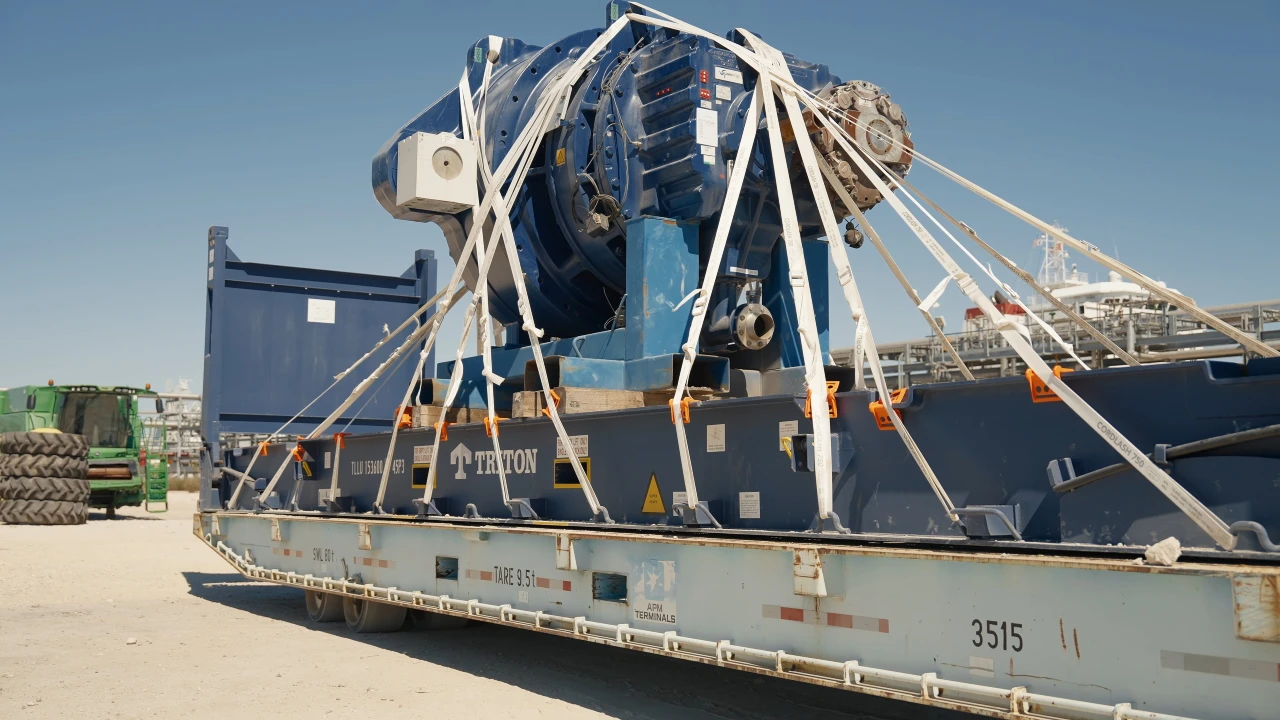
As the fertilizer consumption grows, in the future this will affect the amount of crops and farm equipment that will be required to harvest it. Transporting machinery to a farm can be a daunting task, but Atlantic Project Cargo can solve your problem.
We offer international freight forwarding services such as door-to-door supply chain for air freight and ocean cargo shipping. If you are a farmer and you need to transport your cargo, e.g. agricultural equipment, we are here to help. As a company with great experience, we provide reliable and cost-effective shipping solutions.
Biofertilizers
The growing attention to organic agriculture is contributing to the growth of the biofertilizer market.
Organic agriculture promotes sustainable farming practices that focus on soil health, biodiversity, and environmental conservation. Biofertilizers, as well as synthetic chemicals, effectively increase soil fertility and nutrient availability.
The ‘Biofertilizers Global Market Report’ by the Business Research company says the biofertilizer market was estimated at $2.31 billion in 2023 and is expected to show an average annual growth rate of more than 8.5% between 2024 and 2032. This trend can be explained by strong economic growth in emerging markets and increasing demand for organic food and natural agricultural products.
Government support through subsidies and policies further stimulates the market by encouraging farmers to use environmentally friendly resources. For example, the Foundation for Food and Agriculture Research (FFAR) launched the Efficient Fertilizer Consortium (November 2022). It is a research commission for the promotion of effective, economically and environmentally beneficial fertilizers.
Conclusion
In this article, we reviewed the basic data of the global fertilizer market 2024, how it is changing, the forecast for the following years, and also learned about the new trend in the use of biofertilizers.
The information obtained, as well as independent market tracking, helps farmers and large business owners make reasonable decisions. This is necessary to make the most profitable deals, as well as keep up to date with global innovations and trends.
Read More

